Measuring and evaluation of energy consumption of Gemini B building Prague - ENBRA a.s
| Hardware | 1x PC Sever + 1x PmWebClient |
|---|---|
| Control stations | 194x heat, water, electricity meters |
| Implementation | MICROSYS, spol. s r.o., ENBRA a.s |
| Date of commission | 2015 |
Software system PROMOTIC METERING provides automated data acquisition and processing from energy meters in GeminiB building complex in Prague. System scale:
- 64 electricity meters of the KWZ Moeller type
- 91 calorimeters (heat)
- 38 water meters
- 1 main calorimeter (cooling)

The meters are spread across 11 floors of the Gemini B building. The visualization allows topological overview of all meters in each floor.
Energy consumption metering
Data from calorimeters, water meters and electricity meters are read by the M-BUS protocol. Following values are read from each meter:total energy or quantity (counter sum)
meter type
current power, flow
The PROMOTIC METERING system was created as configurable application - meter addresses and other parameters are read from the configuration file.
Energy consumption evaluation
The system provides archiving of measured data in the database and also evaluates the energy consumtion in defined time-range (day, month, year, defined range).At the end of the month the system generates files containing monthly figures od energy consumption for each consumer: tenants, companies and other units.
The output data is archived into the file in the CSV format for further processing.
Visualization
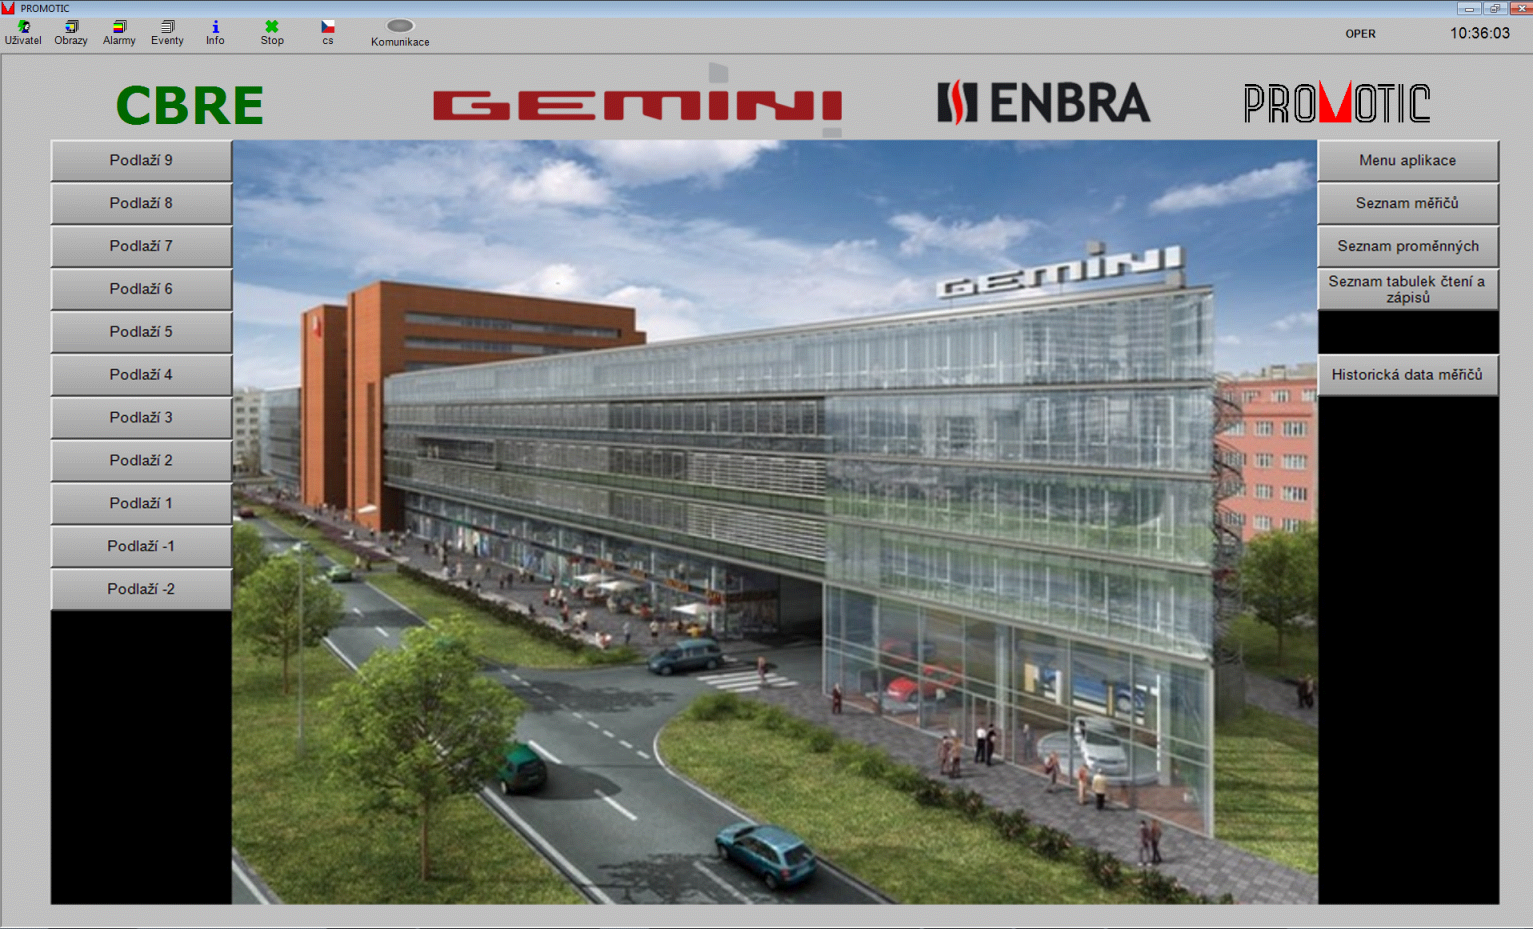
The system allows overview monitoring of current status of all meters, listing in the history, data export into CSV files, etc. Authorized personnel can also set parameters of meters and other system parameters.Main screen:
Overview screen - graphic representation of selected measured values by floors
Table view of online data from selected meter
- Meter type, serial number or ID number
- Time of last successfull communication, communication status, OK/error/disconnencted
- Data read from the meter during last successfull communication
Graphic viewing of measured values time progression (trends)
Alarm system - indication of communication errors with meters
Visualization Web clients
Web server is included in the application providing data visualization on other PCs - visualization Web clients. Web clients allow viewing data indicating current consumption and monthly figures of meters selected by administrator.

Possible system extension:
The system is built as modular and can therefore be easily extended by:additional measured energy values
additional visualization Web clients
monitoring of other technologies (e.g. HVAC units)
connection to enterprise information systems for automated data exports and invoicing calculations
See also:
Navigation:
- Monitoring of energy consumption in Gemini B building Prague
- Complete control and monitoring system ID-6.2 - airports Magnitogorsk (Russia) and Bautzen (Germany)