PmgTrendViewer - Deatiled object description
See: the PmgTrendViewer object.
The graphic face of the viewer is set by the ViewMode property - the data are displayed either in the table mode or in the graph mode.
One trend variable is represented by an object of the tvTrend type. There can be more trend variables (tvTrend objects) in the viewer and thus it is possible to view more trends in one graphic area.
The object of the tvTrend type can be connected to the source of data (e.g. by the tvTrend.Connect method) and in this case the viewer reads the data from the source automatically - from the trend server. The trend server is the PROMOTIC application that stores data by means of the PmaTrendGroup object.
But the trend variable doesn't need to be connected to the server in the viewer and thus data points that form the process of the variable, can be set by calling object methods of the tvPoints type, for example, the tvPoints.AddPoints, see the example Example for displaying mathematical functions by means of the trend viewer. In this case it is also possible to use the onReadData event for the dynamic filling up by the AddPoints method (see the above mentioned example).
The object of the tvPoints type is in both cases (connected or disconnected tvTrend object) the holder of data points (either set by the tvPoints.AddPoints method or read from server).
One trend is displayed by drawing tools - one or more objects of the tvGraph type. The tvGraph objects are created in the tvTrend object and they serve for the definition of the line type (width, color, type etc.) in the graphic mode or the font, text color, etc. in the table mode.
Each tvTrend object has at least one basic tvGraph object and an access to it is made by means of the tvTrend.GraphDefault property.
The tvTrend object can have more tvGraph objects (each can be configured, for example, by different color), they are added by calling the tvTrend.AddGraph method and in this case it is necessary to define at such objects in which time slot which object is drawn, see the sValidityFce parameter of the AddGraph method.
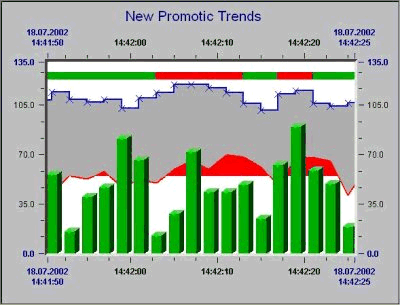
Thus it is possible by means of the tvGraph object, for example, to display the graphic process of the variable that is green by default but in the range of the exceeded limit value this curve is red. In the table mode it is possible by means of the tvGraph object to display values exceeding the limit by different color or by different font.
See the draw type of the tvTrend and tvGraph.
Trends are drawn in the order how tvTrend objects are created (e.g. by methods AddTrend, InsertTrend).
The leading object is drawn as the first and the active tvTrend object is drawn the most on up (the active trend is that from objects in the container whose index in the area equals to the value TrendActive).
The range of the time axis (X) of the viewer is set by the TimeMin and TimeMax properties, the range of the value axis (Y) is set by the tvTrend.ValueMin and tvTrend.ValueMax properties of the active trend.
It is possible to switch on automatic reading the most fresh values of trends and automatic moving the time axis (the time column in the table mode) in the viewer by setting the Autoscroll property to true.
The period of reading is set by the AutoscrollRate property, and the way of reading and moving the time axis by the AutoscrollType property.
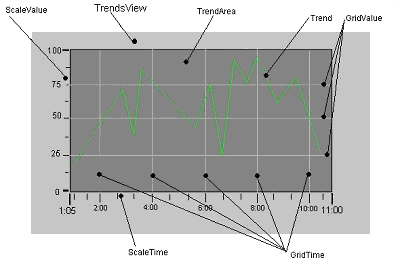
To change setting of the time or value axes is possible in objects ScaleTime or ScaleValue, to change setting of the grid properties is possible in objects GridTime or GridValue.
The current setting of viewer properties including the list of tvTrend objects can be saved into the text configuration XML file and possible read back by methods SaveCfg, LoadCfg.
Both viewers can be printed, for example, by the SaveToHtm method with the help of HTML pages supplied with the viewer in both graphic and table modes. These HTML pages can be copied, edited if necessary and use instead of the original ones supplied with the system.
It is possible to change the list of currently displayed trends dynamically on the runtime by the DlgTrends and tvTrend.DlgProperties methods
Web:
This object is functional also in Web panels.
The control accessible by the mouse or from the keyboard (on the control from the keyboard the object must have the focus that can be obtained, for example, by clicking the mouse or moving the focus by the tab):

Subobjects hierarchy:
The graphic face of the viewer is set by the ViewMode property - the data are displayed either in the table mode or in the graph mode.
One trend variable is represented by an object of the tvTrend type. There can be more trend variables (tvTrend objects) in the viewer and thus it is possible to view more trends in one graphic area.
The object of the tvTrend type can be connected to the source of data (e.g. by the tvTrend.Connect method) and in this case the viewer reads the data from the source automatically - from the trend server. The trend server is the PROMOTIC application that stores data by means of the PmaTrendGroup object.
But the trend variable doesn't need to be connected to the server in the viewer and thus data points that form the process of the variable, can be set by calling object methods of the tvPoints type, for example, the tvPoints.AddPoints, see the example Example for displaying mathematical functions by means of the trend viewer. In this case it is also possible to use the onReadData event for the dynamic filling up by the AddPoints method (see the above mentioned example).
The object of the tvPoints type is in both cases (connected or disconnected tvTrend object) the holder of data points (either set by the tvPoints.AddPoints method or read from server).
One trend is displayed by drawing tools - one or more objects of the tvGraph type. The tvGraph objects are created in the tvTrend object and they serve for the definition of the line type (width, color, type etc.) in the graphic mode or the font, text color, etc. in the table mode.
Each tvTrend object has at least one basic tvGraph object and an access to it is made by means of the tvTrend.GraphDefault property.
The tvTrend object can have more tvGraph objects (each can be configured, for example, by different color), they are added by calling the tvTrend.AddGraph method and in this case it is necessary to define at such objects in which time slot which object is drawn, see the sValidityFce parameter of the AddGraph method.
Thus it is possible by means of the tvGraph object, for example, to display the graphic process of the variable that is green by default but in the range of the exceeded limit value this curve is red. In the table mode it is possible by means of the tvGraph object to display values exceeding the limit by different color or by different font.
See the draw type of the tvTrend and tvGraph.
Trends are drawn in the order how tvTrend objects are created (e.g. by methods AddTrend, InsertTrend).
The leading object is drawn as the first and the active tvTrend object is drawn the most on up (the active trend is that from objects in the container whose index in the area equals to the value TrendActive).
The range of the time axis (X) of the viewer is set by the TimeMin and TimeMax properties, the range of the value axis (Y) is set by the tvTrend.ValueMin and tvTrend.ValueMax properties of the active trend.
It is possible to switch on automatic reading the most fresh values of trends and automatic moving the time axis (the time column in the table mode) in the viewer by setting the Autoscroll property to true.
The period of reading is set by the AutoscrollRate property, and the way of reading and moving the time axis by the AutoscrollType property.
To change setting of the time or value axes is possible in objects ScaleTime or ScaleValue, to change setting of the grid properties is possible in objects GridTime or GridValue.
The current setting of viewer properties including the list of tvTrend objects can be saved into the text configuration XML file and possible read back by methods SaveCfg, LoadCfg.
Both viewers can be printed, for example, by the SaveToHtm method with the help of HTML pages supplied with the viewer in both graphic and table modes. These HTML pages can be copied, edited if necessary and use instead of the original ones supplied with the system.
It is possible to change the list of currently displayed trends dynamically on the runtime by the DlgTrends and tvTrend.DlgProperties methods
Web:
This object is functional also in Web panels.
The control accessible by the mouse or from the keyboard (on the control from the keyboard the object must have the focus that can be obtained, for example, by clicking the mouse or moving the focus by the tab):
Zoom:
- while pressing the Ctrl+Shift keys drag the mouse to specify a field in the trends area.
- by pressing the Shift+arrows key on the keyboard.
Axis move:
- while pressing the Ctrl key drag the mouse across the trends area.
- while pressing the Ctrl key drag the mouse on any scale.
- press the Ctrl+arrows keys on the keyboard.
Cursor move: (only if the cursor is visible)
press one of the arrow keys on the keyboard.
UNDO/REDO of time or value axes changes (only in the graph mode, only changes of the move, range of the time axis and of the value axis are put into the UNDO buffer)
UNDO - press the Alt+Backspace keys.
REDO - press the Ctrl+Y keys.

Subobjects hierarchy:

- TrendsView:
- ScaleValue: (object of the tvScale type) value scale
- Trends: (object of the tvTrend type) trend - the process of one variable
- GraphDefault: (object of the tvGraph type) preset drawing object
- TrendArea: (object of the tvTrendArea type) area where trends are drawn
PROMOTIC 9.0.27 SCADA system documentation MICROSYS, spol. s r.o.
Send page remarkContact responsible person
Send page remarkContact responsible person
Navigation: