The error-free run of the application can be monitored in
Windows OS especially by watching some the most important data, namely:
- Total memory used by a process
- The total number of handles that the process owns
- The total number of graphic objects assigned to the process
From the long-term point of view when the application runs for several days, months, etc. without shutoff, all the above mentioned values shouldn't grow beyond all limits in an uncontrolled way.
It is advisable to watch also the
CPU usage.
The above mentioned three values can be watched globally for all processes or it is also possible (and more suitable for the correct identification of possible instabilities) to watch these values for each process separately.
Watching memory usage by one process (application) in Windows OS 2000/XP
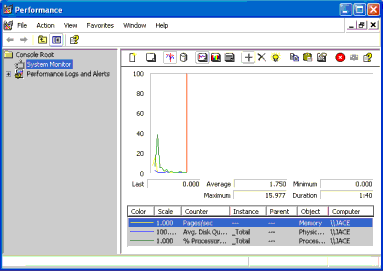
Launch the application
Performance monitor - use the
Start button, enter
perfmon.exe into the
Run input box and launch the application.
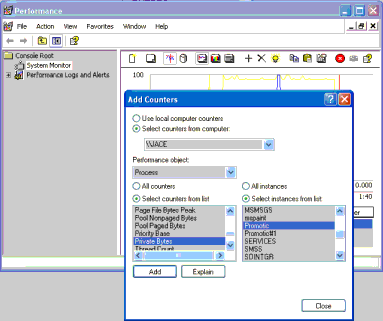
Add the graph of the memory usage by the PROMOTIC application after pressing the
"+" button, see the following picture. You should select the item
Private bytes.
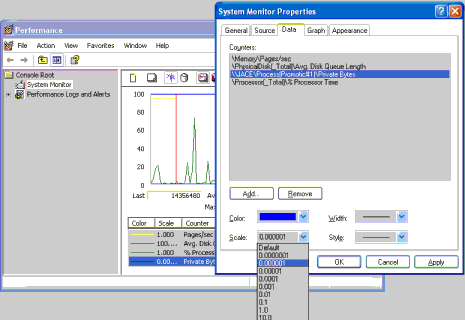
Configure the graphic appearance and location of graph points, see the following picture.
The current value of the memory usage by the PROMOTIC process is shown in the
Last field. Here the
Scale=0.000001 value selected in the picture means the reduction constant. The
Last item has the value
14356480, see the picture. Multiple the
Last value by the reduction constant (in our case
0.000001) and you'll get
14356480*0.000001=14.356480, which is the height where the graphic point that reflects the current value of the
Last item, is placed. In our case on the scale from 0 to 100.
By the
Performance monitor application the current data can also be saved to disk. It is also possible to watch any process running on the computer.
Note: Owing to possible inaccuracies it is not recommended to watch the memory usage of the particular application by the
Task Manager that can be started, for example, by the key combination
Alt+Ctrl+Del. The field
Memory Usage becomes incorrect in the moment when the memory usage of all running applications has overran or it overruns the value of the memory installed on the computer in the current time.
Watching count of handles and GDI objects for one process in Windows OS 2000/XP
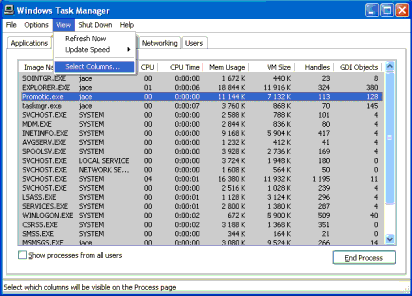
Launch the application
Task Manager - e.g. by the key combination
Alt+Ctrl+Del. Switch into the
"Processes" tab and according to the following picture, select these columns for displaying:
Handles,
GDI objects.
Watching total memory usage, total count of allocated handles of all running processes in Windows OS XP

Launch the application
Task Manager - e.g. by the key combination
Alt+Ctrl+Del. Switch into the
"Performance" tab and select these columns for displaying:
Handles,
GDI objects according to the picture.
Watching CPU usage in Windows OS XP
Launch the application
Task Manager - e.g. by the key combination
Alt+Ctrl+Del.
- Total CPU usage by all running applications is available on the "Performance" tab.
- CPU usage by one application is available on the "Processes" tab. The column CPU has to be selected.
 Launch the application Performance monitor - use the Start button, enter perfmon.exe into the Run input box and launch the application.


 Launch the application Task Manager - e.g. by the key combination Alt+Ctrl+Del. Switch into the "Processes" tab and according to the following picture, select these columns for displaying: Handles, GDI objects.
 Launch the application Task Manager - e.g. by the key combination Alt+Ctrl+Del. Switch into the "Performance" tab and select these columns for displaying: Handles, GDI objects according to the picture.